

World Inequality Report 2018
In the last few decades, inequality has increased everywhere in the world. This is not only one of the causes of poverty and social conflict, but also one of the elements that form the contemporary economic system: globalized capitalism.


This message is conveyed by the 2018 World Inequality Report that was presented in mid December in Paris, France. It’s the first document that discusses this phenomenon on a global scale: the 300-page text was created by approximately 100 researchers from around the world and developed on an enormous database that was made public and therefore available for anyone who wishes to study the analysis in depth. The objective is to present a snapshot of the current situation, comprehend the changes that brought us to it and make hypotheses on possible future scenarios.

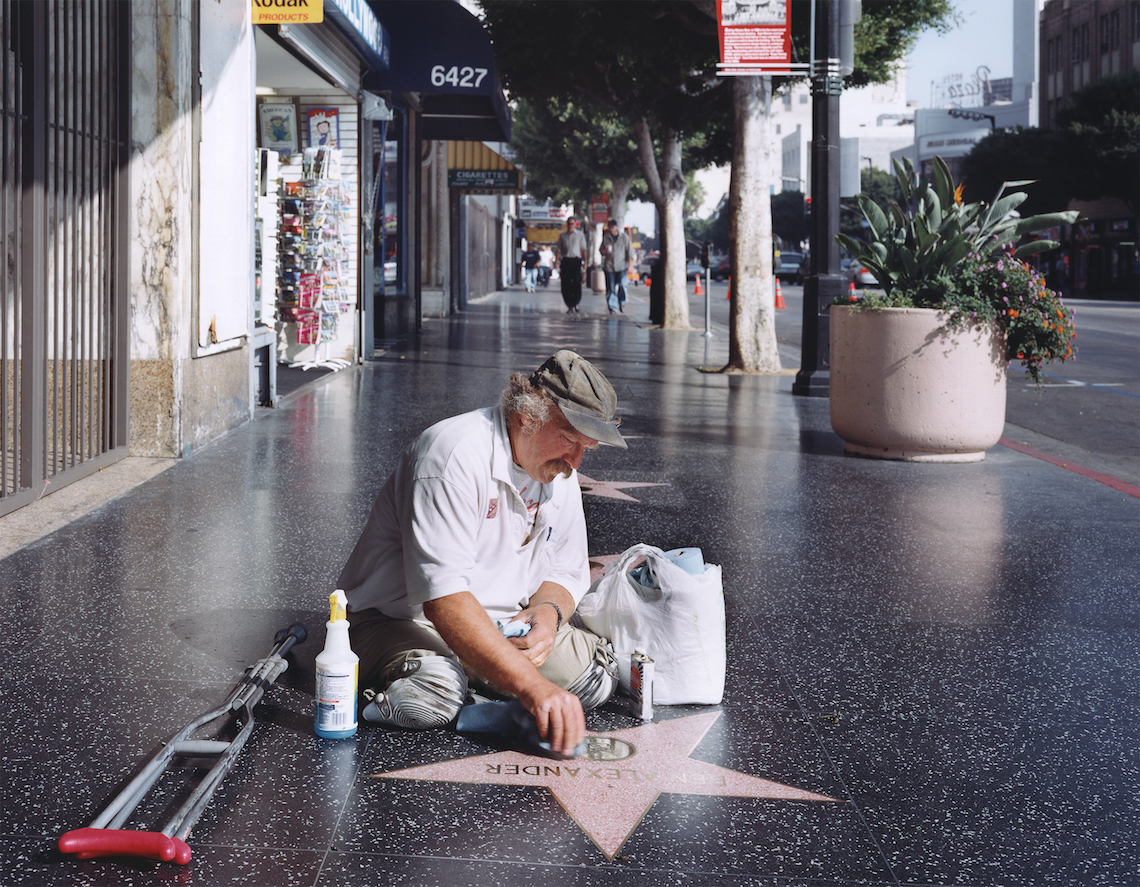
The United States is one of the countries with the widest gap between rich and poor © Mario Tama/Getty Images
The richest 1% is twice as wealthy as the poorest 50%
British economist John Maynard Keynes published The General Theory of Employment, Interest and Money in 1936 explaining that capitalism was not only unable to guarantee sufficiently low rates of unemployment, but had also caused “an unequal distribution of arbitrary wealth”. This consideration is even more true and current 80 years later. In fact, economist Lucas Chancel, the main coordinator of the report, said that “on a global level, the top 1 per cent has pocketed twice as much of the economic growth as half of the bottom 50 per cent”.
The researchers working on the project have explained that “economic inequality is widespread and to some extent inevitable. It is our belief, however, that if rising inequality is not properly monitored and addressed, it can lead to various sorts of political, economic, and social catastrophes“. Especially in countries where the gap between the rich and poor is wider.
© World inequality report 2018
Inequalities in Europe are less prominent than in the US. Record in the Middle East
The World Inequality Report shows that the disparity in wealth distribution varies significantly from one region to another. In Europe, 37 per cent of the national revenue is pocketed by the top 10 per cent, 41 per cent in China, 46 per cent in Russia, 47 per cent in North America and around 55 per cent in sub-Saharan Africa, Brazil and India. The highest value can be found in the Middle East, with 61 per cent.
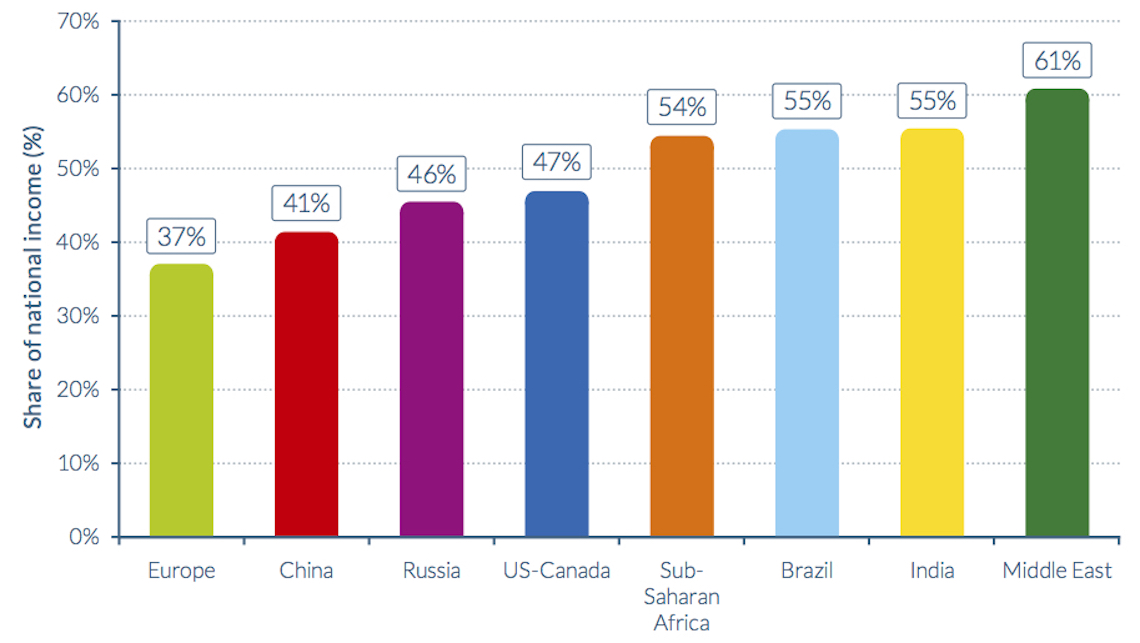
Income of the richest 10 per cent, per country © World inequality report 2018
Data on the development of African economies (supporting the hypotheses expressed by Branko Milanovic’s work, titled Global inequality: a new approach for the age of globalization, where he theorizes the existence of unavoidable waves of inequality) are especially alarming. The disparity that was registered in the distribution of wealth produced in numerous countries within the continent could in fact be a recipe for disaster if combined with the strong demographic growth that is predicted to take place in the same area. Today, Africa hosts 17 per cent of the global population, but this figure is expected to hit 26 per cent in 2050. Between 1993 and 2013, in Italy, the poorest 90 per cent of the population lost 15 per cent of their wealth (from 60 to 45 per cent). Whilst the top 10 per cent gained the remaining 55 per cent.
The wealth of the richest in China and Russia has skyrocketed in the last few decades
Trends from the last few years show a generalised increase of inequalities: from 1980 to 2016, they have grown especially in the United States, China, India and Russia. In Europe too, but less so. The portion of wealth held by the top 1 per cent has increased from 10 to 12 per cent in the old continent. On the other hand, the figure has grown from 22 per cent in 1980 to 39 per cent in 2014. The report states that “the income-inequality trajectory observed in the United States is largely due to massive educational inequalities, combined with a tax system that grew less progressive”, focal point of the liberalist economic theories.
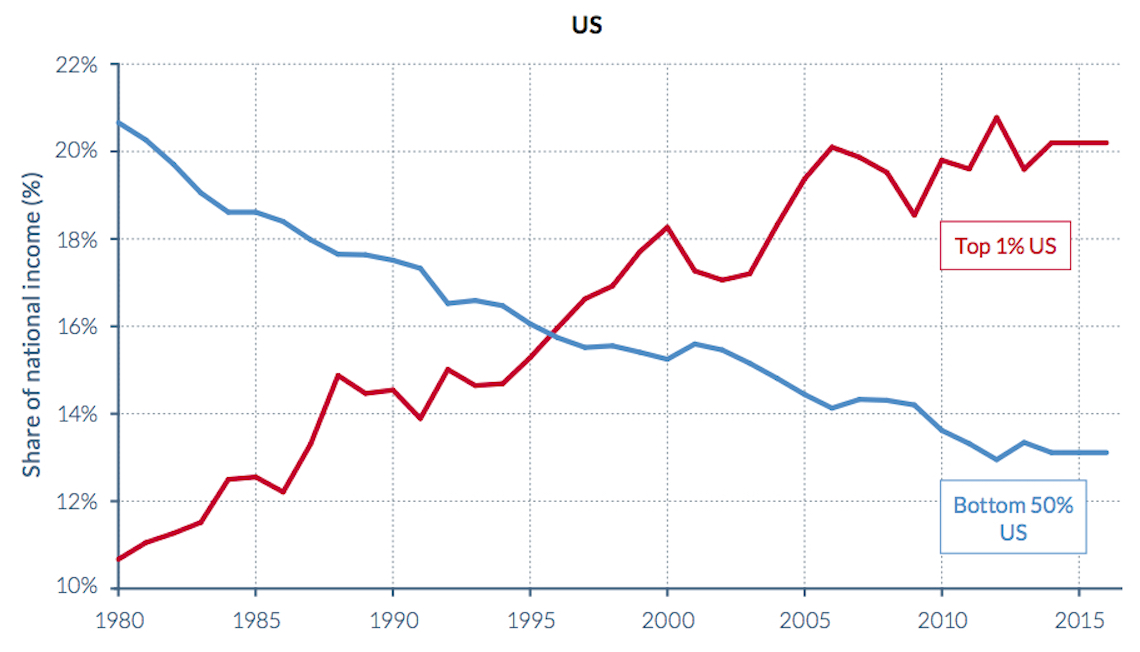
The richest 1 per cent exceeded the poorest 50 per cent in the last decades © World inequality report 2018
In China and Russia, the amount of wealth held by the top percentage of the population has gone from 15 to 30 per cent in China and from 22 to 43 per cent in Russia. In a way this can be seen as good news: the gap between Europe and other countries shows that if they want to, institutions possess the means to limit inequalities. Lowering taxes using progressive rates, introducing transfers that favour the poor, imposing a minimum wage and offering more public services are a few examples of effective methods to contrast the structural tendencies of capitalism that widen the gap between the rich and the poor. A tax on financial transactions is another example.
A decrease in public wealth is among the causes of inequality
The report underlines that the increase in inequalities grew parallel to another phenomenon: the decrease of wealth owned by the public compared to private wealth. The study explains that “there has been a general rise in net private wealth in recent decades, from 200-350 per cent of national income in most rich countries in 1970 to 400-700 per cent today.” And the 2008 financial crisis “didn’t invert the trend”.
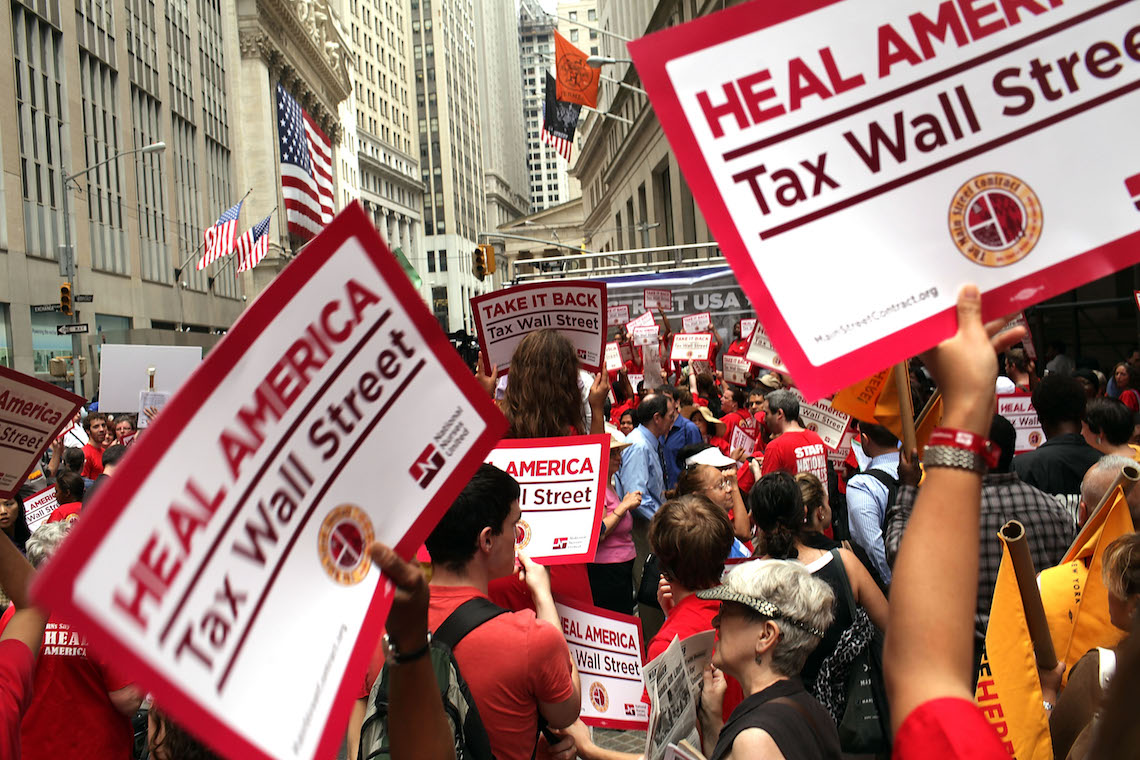
Activists march on Wall Street to hold institutions accountable for financial global crisis © Spencer Platt/Getty Images
In the last few decades, in China and Russia, the percentage of public property went from 60-70 per cent to 20-30 per cent. “This arguably limits government ability to regulate the economy, redistribute income, and mitigate rising inequality. The only exceptions to the general decline in public property are oil-rich countries with large sovereign wealth funds, such as Norway.”
The future depends on the choices we make today
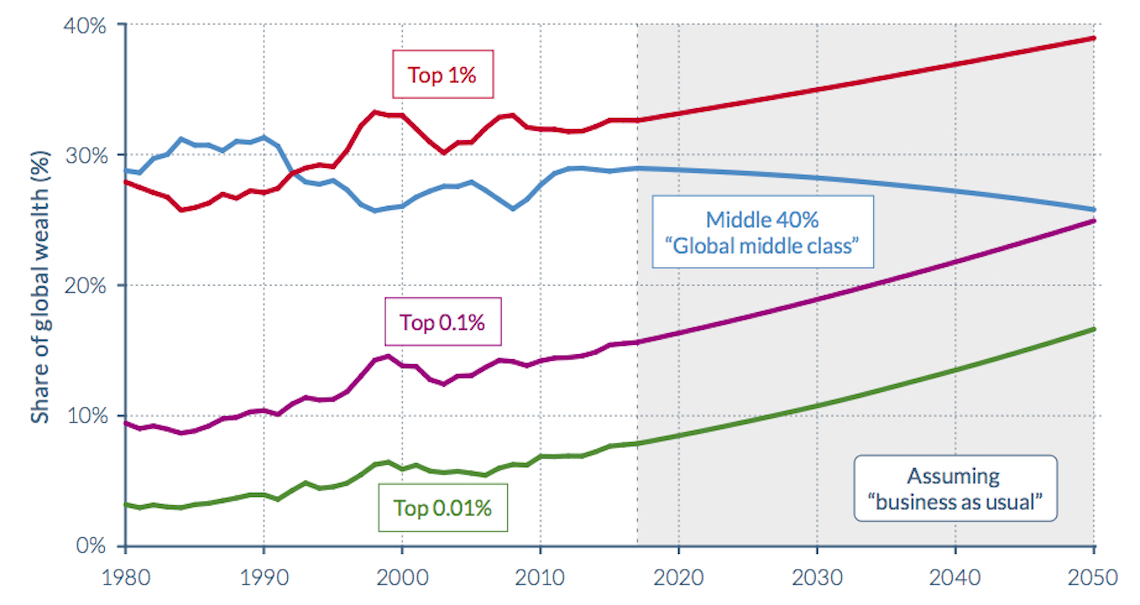
The report also includes some projections for years to come: “The continuation of past wealth-inequality trends will see the wealth share of the top 0.1 per cent global wealth owners (in a world represented by China, the EU, and the United States) catch up with the share of the global wealth middle class by 2050”. Things will be even worse if the world adopts the North American liberalist approach. On the other hand, the gap will shrink if we opt for European model.
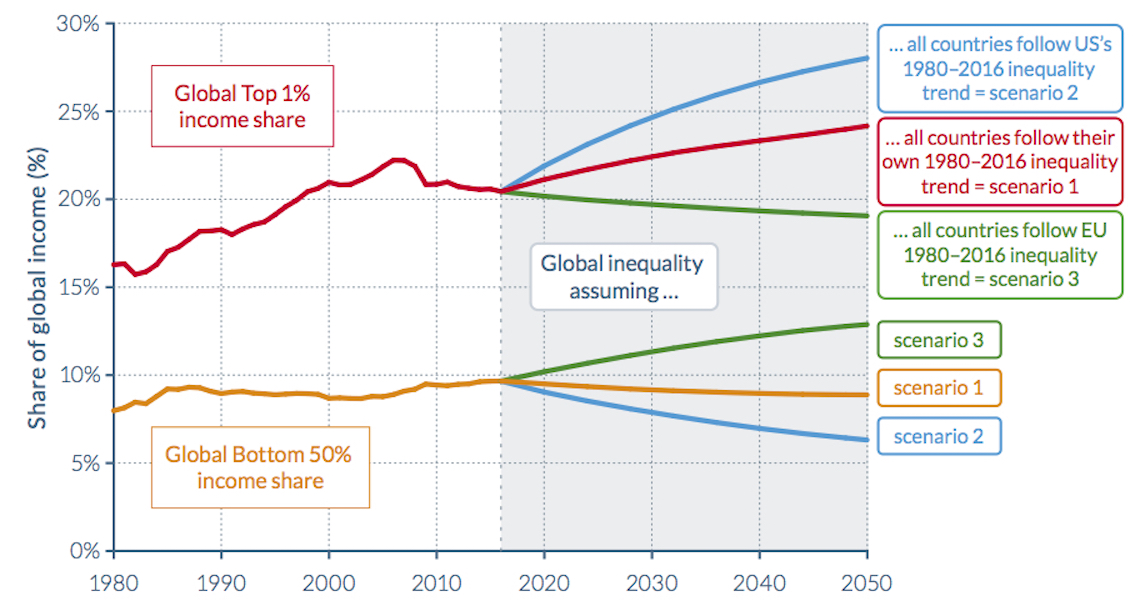
Three scenarios of inequalities evolution up to 2050 © World inequality report 2018
This will all be accompanied by drastic set backs in terms of poverty: the average yearly income of an adult who is part of the poorest 50 per cent of the world population is 3,100 euros. In 2050 this figure will rise to 9,100 if the European model is adopted, and only 4,500 if the American one is followed.